Let us discuss about Fiddler HTTP debugging or Fiddler HTTP sniffer tool (Fiddler2 is new version) which can be used as an HTTP debugger that helps in testing the performance of your website or web application. Fiddler proxy really useful since the fiddler HTTP request interceptor allows to put break points to achieve fiddler HTTP debugging. You can freely download fiddler HTTP tool to monitor HTTP(s) traffic from IE, Firefox etc..
If you are a web developer or a webmaster who usually monitors the performance of your website then this tool can help you in a number of ways. Fiddler can be used to analyze and test how your browser interacts with your website or web application hosted in internet. Fiddler is a Web Debugging Proxy which logs all HTTP(S) traffic between your computer and the Internet. Fiddler HTTP header monitor feature allows you to analyze the header details of HTTP request and response. The latest version Fiddler2 which is an HTTP debugger offers support for interception and tampering with HTTPS traffic.
It allows you to inspect all HTTP(S) traffic from and to your system and internet. The most interesting feature is that you can set breakpoints and “fiddle” with incoming or outgoing data. This means that you can inspect the cookies being sent and verify the downloaded contents attributes. Fiddler is freeware and can debug traffic from most application, including Internet Explorer, Mozilla Firefox, Opera etc.
How Fiddler works?
The Fiddler acts as a proxy between your browser and the web server (the server where the website is hosted).
All HTTP requests from browser flow through Fiddler before reaching the website (the target Web server). Similarly all HTTP responses from the web servers flow through Fiddler before being returned to the browser (client application).
On start up fiddler registers itself as the system proxy, which listens on port 8888, for Microsoft Windows Internet Services and then re-routing all requests and responses through it. WinInet is the HTTP layer used by Internet Explorer, Microsoft Office. When you close fiddler it automatically unregisters itself as the system proxy.
Use Fiddler for Performance Testing
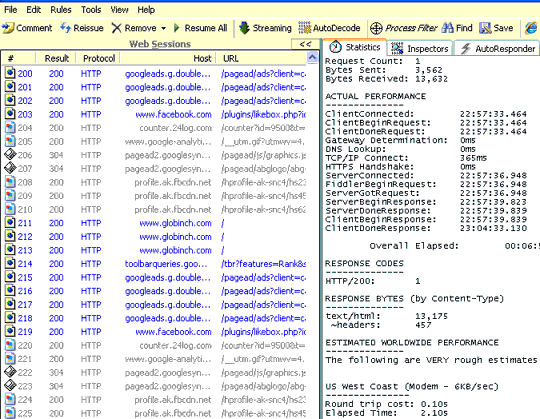
You open any website using Internet Explorer or FireFox and you’ll instantly see a list of the web requests that are being made in Fiddler. See the below screen shot.
Click on any request in the left side panel and open the “Statistics” tab on right side panel , you can see the actual performance summary. To know the performance summary of a complete page you can select all the requests issued for that page together and check the performance summary. The interesting thing is that Fiddler2 also gives a rough worldwide performance estimate. This you can see in the “Statisics tab“.
This way you can inspect session performance of your website or web applications.
You can check the cookies being sent in the inspector tab. You can check the HTTP request headers and response headers. It gives you ore insight on Cache-control, Cach-expiry , content length, transport type (Content encoding like GZIP) etc. We have already discussed all these topics in our previous articles. Click the links to read more.
There are many tabs which shows many useful information like Caching, Transformer and different views.
Fiddler 2: Enabling automatic response
Fiddler can be configured to return automatic responses. If you set this option Fiddle can return previously generated response without connecting to the server. Certainly you can configure rules to permit required URLs to pass through and fetch response from the actual server.
Fiddler 2: Applying filters
You can apply filter rules to make use of this tool more efficiently. For example if you are testing your website, you may need to find out the all the responses that are not “200 OK” . This will gives you all those results which are actually one of the many error scenarios. For example you can easily find out different HTTP statuses which doesn’t represent a success response like “301 — Moved Permanently“, “400 — Bad Request“, “404 — Not Found“, “500 — Server Error” etc. This will help you to find out the issues in your site.
Fiddler 2: Debugging HTTP Traffic
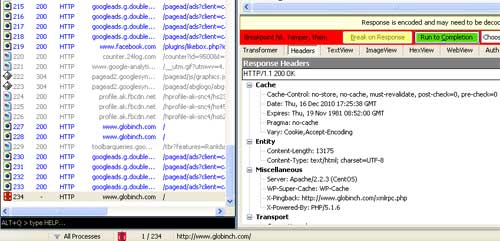
You can debug HTTP traffic to a site using Fiddler. Go to “Rules” -> “Automatic Breakpoints” and set the breakpoints option. Then issue a request in browser. If breakpoints is enables you will see the debug enabled icon in the session. Click the session and open the “Inspectors” tab. You can click on the “Break on Response” button. This will break on response and you can view or tamper the response and then click on “Run to completion“. See the screen shot below.
Fiddler is a great tool for debugging problems in distributed applications as well as to debug Web based applications for objects like Cookies, custom headers and you can easily view content. You can preview images , XML and you can setup viewers to any request or response content.
System Requirements
- Windows 2K / XP / 2K3 / Vista / 2K8 / Win7
- Microsoft .NET Framework v2.0 or later
- 8 megabytes disk space / 800mhz processor
- 256 megabytes RAM minimum
After installation you can see an icon in IE toolbar. Or you can start directly from windows Start menu-> All programs
DOWNLOAD Fiddler2
This is often one of the best approaches to study the game speedily and proficiently, along with be a of greater profits for additional qualified players.