Speed Tracer Google Chrome Extension from Google Web Toolkit to identify and fix web application performance issues.
Slow loading web application or website always creates issues. Sometimes it becomes difficult to identify and fix the areas which cause the performance bottleneck. Finding the right tool to debug and analyse web applications is critical to find and resolve the problems quickly.
The big question is which is the best tool to identify, analyse and fix performance related problems in your web application? There are many such tools, but very few of these tools provide proper profiling and insights that helps the developers to arrive at a solution for the performance issues.
Speed Tracer is one such extremely useful tool that helps you to solve critical performance problems in your web applications. Speed Tracer is a part of Google Web Toolkit. It is available as a Chrome Extension that allows you to pinpoint performance problems in your web applications so that you can take necessary steps to fix them.
Related Read:
- 45 Plus Most Basic Web Design and Webmaster Tips
- Top Tips to Speed Up website – Website and Blog Optimization
- Minify JS (JavaScript) and CSS Files to Speed Up Your Website.
If you are not familiar with Google Web Toolkit (GWT) then let us quickly see what is the purpose and use of GWT. Google Web Toolkit is a development toolkit for building and optimizing complex browser-based application. It helps you to build high-performance web applications. You can find more about Google Web Toolkit.
How to install Speed Tracer?
As we mentioned Speed Tracer is available as a Google Chrome extension. But you need to install the Chrome Developer Channel version of Google Chrome to use this extension. The Google Chrome Developer Channel gets updated once or twice weekly, and includes all the latest features which may not be available in the latest stable release or beta release.
Go to Chrome Release Channels to read more and install.
Once you install Google Chrome Developer Channel version then you can install Speed Tracer extension of Google Chrome.
Using Speed Tracer to identify and Fix performance issues
To use the speed Tracer you must start Chrome with the flag: –enable-extension-timeline-api as explained here.
Once Speed Tracer is installed you can see a stopwatch icon to the right of the browser’s web address field. Speed Tracer can be used to pinpoint where exactly the web application takes more time to load. It can identify and record issues that are caused by JavaScript parsing and execution, Layout loading, CSS style recalculation and selector matching, DOM Event handling, Network resource loading, XMLHttpRequest callbacks (Ajax callbacks),Page Painting etc.
There are controls available to analyse page loading, to record events, reset collected data, save profiling data file, Zoom, reports etc.
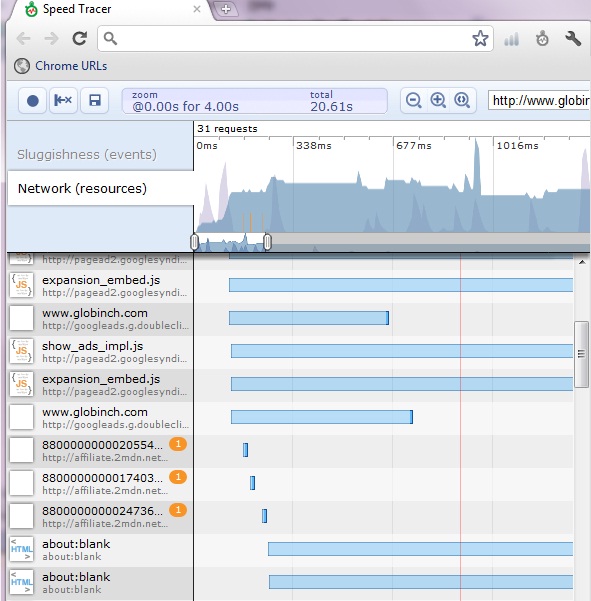
The tool provides a number graphs and charts that display details various parameters of web application performance. The Network (resources) graphs to help you to analyse details on network event. See a sample network graph below.
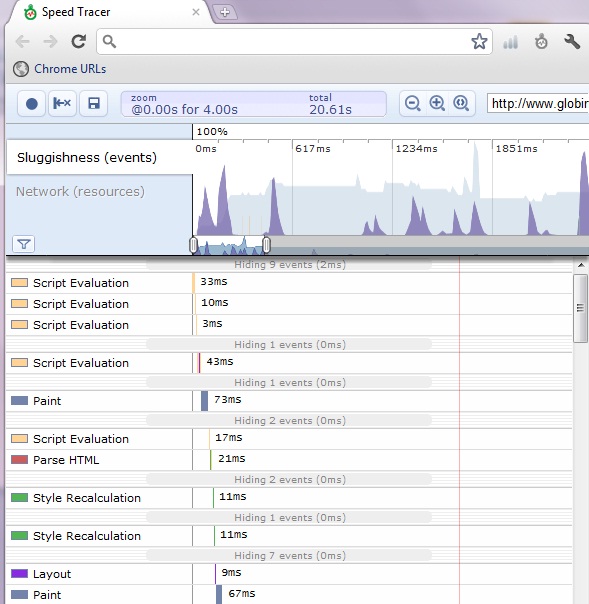
Timeline Graphs and Sluggishness Graph provide indication of how responsive the user interface is at the specified time.
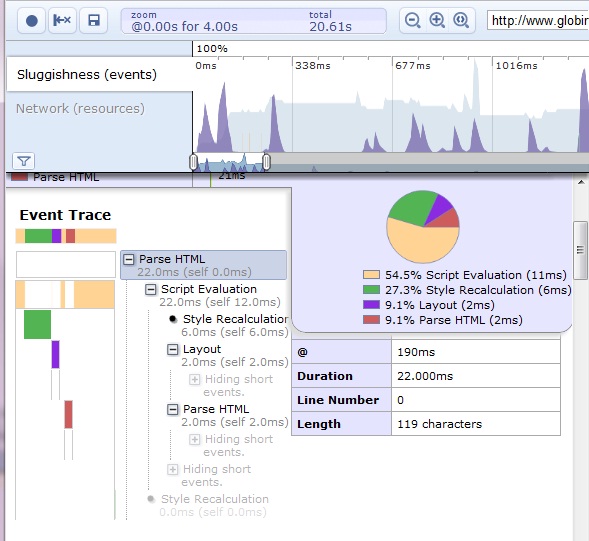
As you know the Tall peaks in the graph indicate the browser is blocked for a significant amount of time. Red lines indicate the critical or highest priority hint and the green lines the lowest priority hints. Event details can be viewed by clicking individual events.
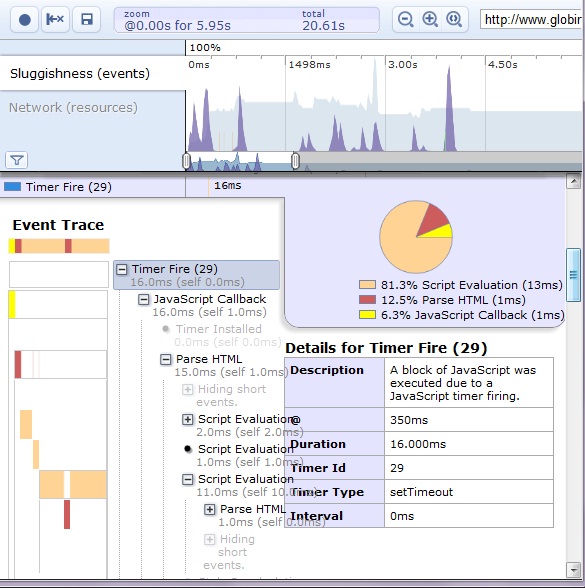
The Timer Fire graph shows JavaScript Callback time, Parsing, Garbage Collection etc. See example below.
Speed Tracer helps you in a number of ways and provides large number of inputs to identify the exact location of the problem. There are many different indications and graphs are available to analyse and evaluate the problems of any web application. You can read more detailed explanation of the Speed Tracer features and understand them.
