If you are a web developer who writes JavaScript functions for your website you can take advantage of JavaScript debugger tools.If you are familiar with any IDE then debugging will be an easy task for you. Venkman from Mozilla is such a tool that is really useful in debugging and profiling your JavaScript files.
Even if you don’t write any JavaScript you can still use the JavaScript debugger and Profile tool to verify the problems with your JavaScript files.The Profiler can help you in validating the efficiency of the JavaScript functions by analyzing the execution data collected by the profiler.
Related:FireBug- A Firefox extension to Inspect HTML CSS and modify style in real-time.
Venkman is the code name for Mozilla’s JavaScript Debugger. Venkman aims to provide a powerful JavaScript debugging environment for Mozilla based browsers.
For Firefox you can download the plug-in from here.
Using Venkman
You can start Venkman JavaScript Debugger from the Tools->Web Development->JavaScript Debugger menu or by typing ‘x-jsd:debugger‘ in the URL bar. This will launch Venkman browser front end.There is also a command line option available.
Setting breakpoints
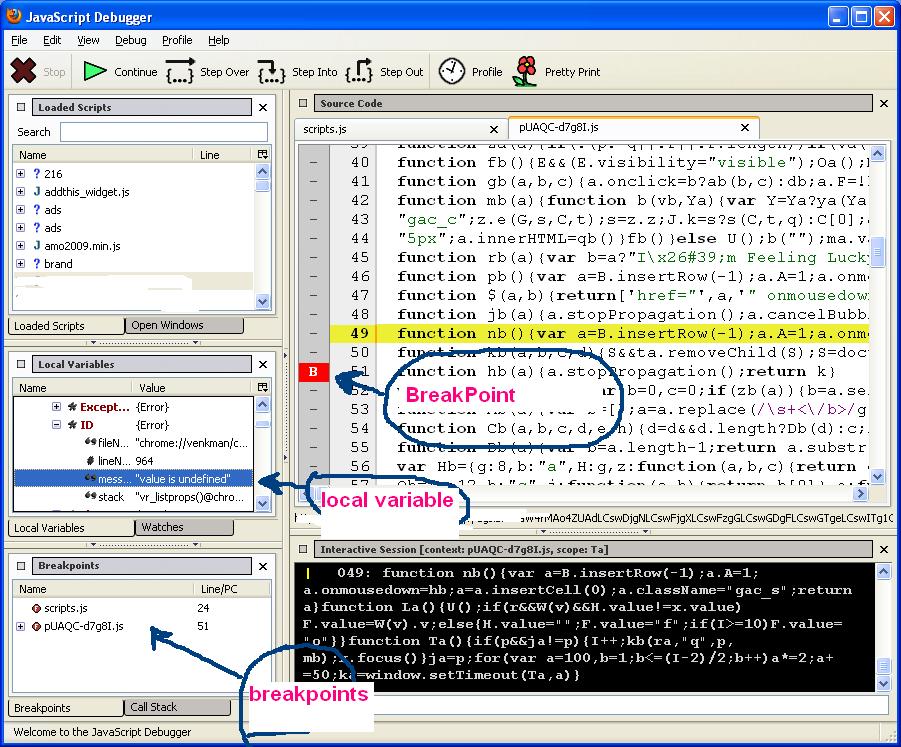
You can set a break point by locating the line you are interested in and click once in the left margin of the Source Code view. This will put a breakpoints at that point.
See the screen-shot below.
 If the breakpoint appear as a solid red stop sign indicates that the breakpoint has been set.For future breakpoints it will display as ‘F’.A Future Breakpoint means that Venkman was unable to set a hard breakpoint now, but if the file is loaded later, and it has executable code at the selected line number, Venkman will automaticaly set a hard breakpoint.
Uisng breakpoints you can debug the JavaScript during the its load and can verify the local variable values.
Another interesting feature is the Profiler.Profile can be used to measure execution times for your scripts. You can enable profiler by clicking the profile button in the toolbar.If the Profiler is enabled Venkman will collect call count, maximum call duration, minimum call duration, and total call duration for every function called.This is a very useful tool that will help you to find out the execution time of your JavaScript.You can use this to find out which function is less efficient9 taking more time to execute) and so on.
To learn more about Venkman visit here.
To know more about Venkman project read it here.

Nice post .. Thanks for the explanation
@MahuaThanks for visiting
Nice tool.. I started using it ..Thanks for sharing ..
@geek Glad to know that this post helped you
Good…